|
|
|
|
2013年07月23日 |
|
|
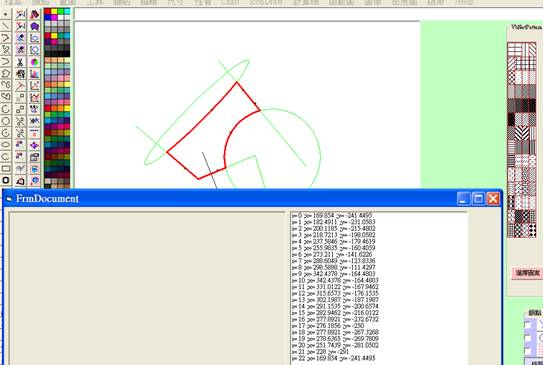
How to get Perimeter, Area, Coordinates of an irregular region from FloodFill The API ExtFloodFill can fill any shapes, but it is hard to do graphic transformation operations. If you need to transform an irregular region, and you have the datum of each elements which consist the polygon, you can convert the line,arc,ellipse,spline ,etc. to polyline ,and then joint polyline one by one ,finally you’ll get the vertex coordinates of this irregular polygon (Convex or Concave) like the figure shown as following.
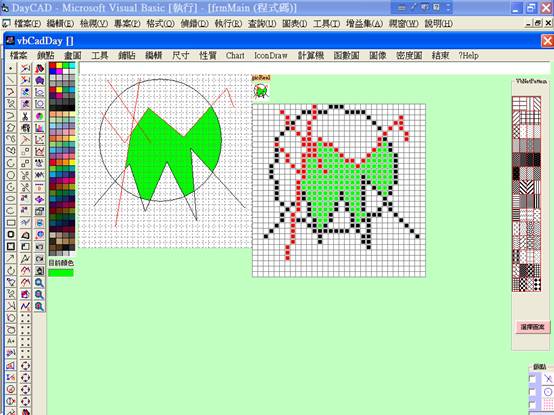
If a polygon is convex, you can get the pixels coordinates of the floodfill region, and then making a convex hull. From this convex hull boundary, you can get the boundary coordinates of the polygon directly. You can get the net area of floodfill region by counting the number of pixels being filled also. To find the Perimeter of the region is more tedious then area calculating, first, we need fill the irregular region by floodfill method to get all pixel points. To collect each row of color pixels points, and arrange the x coordinates of each row in increasing order, and collecting the continue sets of x values, picking the beginning and ending x values of each set, those sets of x values are the region boundary oints( including the barrier lines )of each row. Please refer the flowing picture, the left part is a closed region, surrounding by two polylines, one arc, two lines (one is barrier, ie. not crossing through the region).The right part is a digital drawing after applied floodfill operation.
Suppose the digital data of some row is like : Grid order “3456789012345678” Color order“bggggbwwbgggbwwb”:b=back,g=green:w=white Then, we can pick up two continue pixel sets (3~8), (11~15), which means the boundary points are at grids 3,8,11 and 15. Following the same procedure, we can filter the boundary points in y direction. Combining x and y boundary points, and removing duplicated (double) points will get the perimeter of an irregular region (including the length of barrier). Finally, we can get the coordinates of an irregular region, just trace the boundary points(a continue pixel region) in clockwise or anti-clockwise direction step by step and collect the boundary pointing in order. The procedure of Boundary tracing method is made up of following parts: (a) Using FloodFill alogorithm to fill the irregular region and to get the filling points( ptsFilled() as pointAPI). (b) Find the minimum and maximum of x and y of the region. (c) Collect the x-coordinate of each row of a region in increasing order. (b) Picking up the boundary point of each row of the irregular region in x and y direction, and plotting the boundary points on a form (picturebox or buffer). (c) Tracing boundary point in clockwise or anti-clockwise direction and collect the the points(ptsBDL() as pointAPI) in oreder. Hereafter is some key code of the program.
(a) Function GetPointsFromFloodFill_0()
Public Function GetPointsFromFloodFill_0(canvas As PictureBox, ptFill As CadPoint, mbackcolor As Long, mFillColor As Long, yFctUse As Single, ptsFilled_0() As POINTAPI) As Long canvas.ScaleMode = 3 Dim Location As POINTAPI Dim Points As New Collection Dim stArray() As String Dim width As Integer: width = canvas.ScaleWidth Dim height As Integer: height = canvas.ScaleHeight Dim ST As String Dim count As Long, i As Long, j As Long, K As Integer, L As Integer Dim Ycount As Integer Dim xyFColls() As New Collection, xyFCollsP() As New Collection, nxyFColls As Integer Dim mPolyline() As PolylineAPI, nPoly As Integer Dim BDLColls As New Collection, nSectMax As Integer Dim ww As Integer: ww = width - 1 'int ww = width -1; Dim hh As Integer: hh = height - 1 'int hh = height -1; Dim p As POINTAPI Dim npt As Integer, myLine As LineAPI, myPoint As POINTAPI Erase ptsFilled_0 Location.X = CLng(canvas.ScaleX(ptFill.X - canvas.ScaleLeft, canvas.ScaleMode, vbPixels)) 'xp= Location.Y = CLng(canvas.ScaleY(ptFill.Y * yFctUse - canvas.ScaleTop, canvas.ScaleMode, vbPixels)) 'xp= 'lcPtFill = Location If (Location.X < 0 Or Location.X >= width Or Location.Y < 0 Or Location.Y >= height) Then Exit Function If (Abs(mbackcolor - mFillColor) <= 2) Then Exit Function If Abs(canvas.Point(Location.X, Location.Y) - mbackcolor) >= 2 Then Exit Function npt = 0 Points.Add Location.X & "," & Location.Y
On Error Resume Next Do While (Points.count > 0) ST = Points.Item(Points.count) stArray = Split(ST, ",", -1, vbTextCompare) p.X = Val(stArray(0)) p.Y = Val(stArray(1)) ReDim Preserve ptsFilled_0(0 To npt) ptsFilled_0(npt).X = p.X ptsFilled_0(npt).Y = p.Y 'Call Min_Max(p.X, p.Y, xMinBdl, yMinBdl, xMaxBdl, yMaxBdl) npt = npt + 1 Points.Remove (Points.count) SetPixel canvas.hdc, p.X, p.Y, mFillColor
If (p.Y > 0 And Abs(GetPixel(canvas.hdc, p.X, p.Y - 1) - mbackcolor) <= 2) Then SetPixel canvas.hdc, p.X, p.Y - 1, mFillColor Points.Add p.X & "," & p.Y - 1 ReDim Preserve ptsFilled_0(0 To npt) ptsFilled_0(npt).X = p.X ptsFilled_0(npt).Y = p.Y - 1 npt = npt + 1
End If If (p.Y < hh And Abs(GetPixel(canvas.hdc, p.X, p.Y + 1) - mbackcolor) <= 2) Then SetPixel canvas.hdc, p.X, p.Y + 1, mFillColor
Points.Add p.X & "," & p.Y + 1 'points.Push(new Point(p.X, p.Y + 1)); ReDim Preserve ptsFilled_0(0 To npt) ptsFilled_0(npt).X = p.X ptsFilled_0(npt).Y = p.Y + 1 npt = npt + 1
End If If (p.X > 0 And Abs(GetPixel(canvas.hdc, p.X - 1, p.Y) - mbackcolor) <= 2) Then SetPixel canvas.hdc, p.X - 1, p.Y, mFillColor Points.Add p.X - 1 & "," & p.Y ReDim Preserve ptsFilled_0(0 To npt)
ptsFilled_0(npt).X = p.X - 1 ptsFilled_0(npt).Y = p.Y npt = npt + 1
End If If (p.X < ww And Abs(GetPixel(canvas.hdc, p.X + 1, p.Y) - mbackcolor) <= 2) Then SetPixel canvas.hdc, p.X + 1, p.Y, mFillColor Points.Add p.X + 1 & "," & p.Y ReDim Preserve ptsFilled_0(0 To npt)
ptsFilled_0(npt).X = p.X + 1 ptsFilled_0(npt).Y = p.Y npt = npt + 1
End If Loop GetPointsFromFloodFill_0 = UBound(ptsFilled_0) End Function
(b) Sub GetBoundaryPoints()
Private Sub GetBoundaryPoints(canvas As Picture, ptFillAt As CadPoint, canvasBackColor As Long, ColorFill As Long, ptsBDL() As POINTAPI, Optional nBdl_0 As Long = 0, Optional nArea_0 As Long = 0)
Dim tPolyline As PolylineAPI Dim ptsFilled() As POINTAPI Dim npt_0 As Long Dim i As Long, j As Long, L As Integer, count As Long Dim stArrayA() As String, stArrayB() As String nArea_0 = GetPointsFromFloodFill_0(canvas, ptFillAt, canvasBackColor, vbGreen, 1, ptsFilled) npt_0 = UBound(ptsFilled) '--------------------
Dim xmin As Long, ymin As Long, xmax As Long, ymax As Long, YFix As Long xmin = 9999999 ymin = 9999999 xmax = -9999999 ymax = -9999999 For i = 0 To npt_0 If ptsFilled(i).X > xmax Then xmax = ptsFilled(i).X If ptsFilled(i).Y > ymax Then ymax = ptsFilled(i).Y If ptsFilled(i).X < xmin Then xmin = ptsFilled(i).X If ptsFilled(i).Y < ymin Then ymin = ptsFilled(i).Y Next i List2.AddItem "xmin= " & xmin & ";" & ymin & ";" & xmax & ";" & ymax 'X Direction Dim xLay() As Long count = 1 For i = ymin To ymax YFix = i Erase xLay For j = xmin To xmax ReDim Preserve xLay(1 To j) xLay(j) = -99999 Next j
For j = 0 To npt_0 If ptsFilled(j).Y = YFix Then xLay(ptsFilled(j).X) = ptsFilled(j).X End If Next j
Dim stIn As String stIn = Trim(Str(YFix) & ";") For j = xmin To xmax If xLay(j) > 0 Then stIn = Trim(stIn & "," & Str(xLay(j))) End If Next j
Dim stOut As String, Nsect As Integer, K As Long '----------------------- stIn = Replace(stIn, ";,", ";") Call groupINTColl(stIn, stOut, Nsect)
If InStr(stOut, ";") = 0 Then stArrayA = Split(stOut, ",", -1, vbTextCompare) For K = 0 To UBound(stArrayA) If CLng(Val(stArrayA(K))) <> 0 Then Picture2.PSet (CLng(Val(stArrayA(K))) + 50, YFix + 50), vbBlue ReDim Preserve ptsBDL(1 To count) ptsBDL(count).X = CLng(Val(stArrayA(K))) ptsBDL(count).Y = YFix count = count + 1 End If Next K Else stArrayA = Split(stOut, ";", -1, vbTextCompare) For K = 0 To UBound(stArrayA) stArrayB = Split(stArrayA(K), ",", -1, vbTextCompare) For L = 0 To UBound(stArrayB) If CLng(Val(stArrayB(L))) <> 0 Then Picture2.PSet (CLng(Val(stArrayB(L))) + 50, YFix + 50), vbBlue ReDim Preserve ptsBDL(1 To count) ptsBDL(count).X = CLng(Val(stArrayB(L))) ptsBDL(count).Y = YFix count = count + 1 End If Next L Next K End If Next i '---------------------------------------------
'Y Direction (neglect) ' ' '
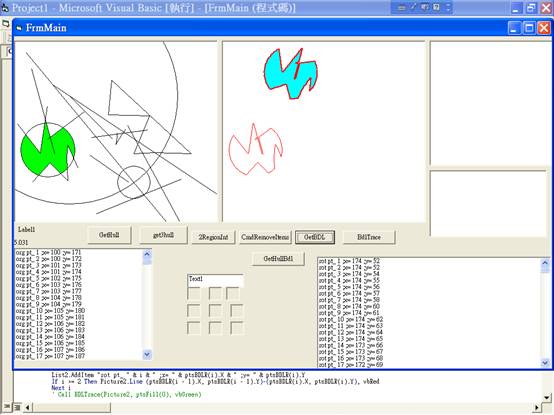
Picture2.Cls Call DuplicatePointAPI_Remove(ptsBDL) nBdl_0 = UBound(ptsBDL) ReDim Preserve ptsBDL(1 To nBdl_0) For i = 1 To nBdl_0 Picture2.PSet (ptsBDL(i).X, ptsBDL(i).Y), vbRed Next i End Sub (c) NextPoints(ptXYcoll, isBarier) The Sub NextPoints() is quite simple ,so please implement yourself. The following picture is the result by using this method , the region(shown on the second picturebox) filled using color cyan, is transform to point(360,350) first, and then rotated 30° at point(360,350) .IF the region is big, then you need to use API GetPixel() and SetPixel() or to process the floodfill in buffer memory to improve the computing speed.
|
上次修改此網站的日期: 2013年07月19日