
|
|
|
|
2018年12月02日 |
|
|
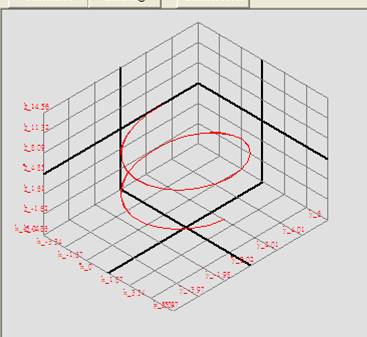
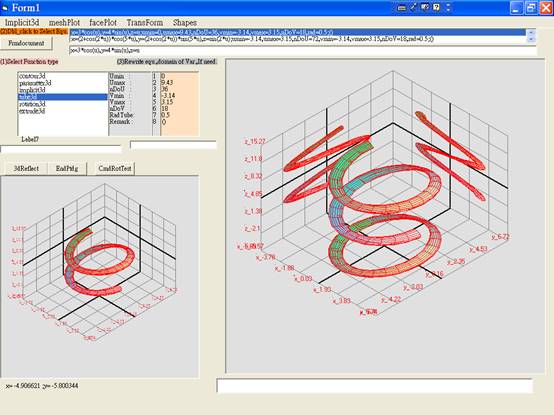
Tube plot in VB 6.0/ VB NET Tube Plot Parametric curves in three space can be difficult to Visualize and draw without the help of graphing package, for a 3D curve like x=4cos(t),y=4sin(t),z=t (0<=t<=3pi) It’s graph shown as following is drawn by computer,
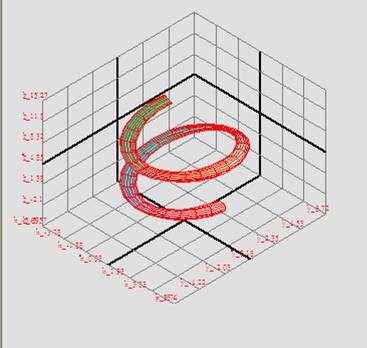
It is still difficult to tell the intersection from which one is in front of the other. To solve the visualization problem, we can draw this kind of curve by drawing the curve enclosing with a thin tube as shown following. Such graphs are called tube plot.
A tube plot is a special case of so called extruded surface. A shape extrusion is the process of forcing a shape displacement along a specific path like the figure shown as following. The basic shape(red) displace along a path(black) get the surface(blue),if the path is a smooth 3d line and the basic shape is a circle then the extruded surface is a 3d tube surface.
Tube Drawing The concept of tube drawing is quite simple and easy. The process of tube drawing can be summarized as following:
(1)To divide path line as some line segments,ptspath(0)~ptspath(n+1). (2)At point ptspath(0), we find a point on the circle(radius is given) as a start point, ptStart. (3) Rotate the ptStart about line segment ptspath(0)_ptspath(1) m times ,each time using (360/n) degree,we get the basic circle at stage 0, points(0,0)~points(0,m). (4) Move ptStart to next Stage, call ptStart_1, then rotate the ptStart_1 about line segment ptspath(1)_ptspath(2) m times getting points(1,0)~points(1,m). . . . (5) Move ptStart to n Stage, call ptStart_n, then rotate the ptStart_n about line segment ptspath(n-1)_ptspath(n) m times getting points(n,0)~points(n,m). (6) Tranform the 3d points(i,j).Coord(0~3) to 2d projector point points(i,j).Trans(0~3) (7) Draw tube surface.
The key snippet codes in Vb(VB Net) are listed as following:
Part A: Type ptXyz ‘Structure ptXyz for VB Net X As Single Y As Single Z As Single End Type ‘End Structure for VB Net
Type Point3D coord(0 To 3) As Single ' Original coordinates. trans(0 To 3) As Single ' Translated coordinates. PrjBotm(0 To 1) As Single PrjSide(0 To 1) As Single PrjBack(0 To 1) As Single ptRGBcol As Long End Type Public Type LineXyz pts(0 To 1) As ptXyz End Type
‘V1Domn2=x2; V1Domn1=x1 ‘V2Domn2=y2; V1Domn1=y1 ‘V3Domn2=z3; V1Domn1=z1 ‘NdoXU: No of loop along path line. ‘NdoYV: No of loop along circle shape.
dxU = (V1Domn2 - V1Domn1) / (NdoXU - 1) dyV = (V2Domn2 - V2Domn1) / (NdoYV - 1) ReDim ptsPath(0 To NdoXU + 1) For i = 0 To NdoXU + 1 Dim uTpt As Double uTpt = CDbl(i * dxU) ptsPath(i) = newPointXyz(GetX_Y_ZValFromU(glVbScriptA, XEq, uTpt), GetX_Y_ZValFromU(glVbScriptB, YEq, uTpt), GetX_Y_ZValFromU(glVbScriptC, ZEq, uTpt)) Next i Dim AngRot As Single Dim ptTpt As ptXyz ReDim Points(0 To NdoXU, 0 To NdoYV) For i = 0 To NdoXU 'along path Dim mLine As LineXyz, ptStart As ptXyz mLine.pts(0) = ptsPath(i) mLine.pts(1) = ptsPath(i + 1) If i = 0 Then ptStart = ClosestPtAtEndLineXyz_DistGiven(mLine, radTube) Else ptStart.X = ptStart.X + ptsPath(i).X - ptsPath(i - 1).X ptStart.Y = ptStart.Y + ptsPath(i).Y - ptsPath(i - 1).Y ptStart.Z = ptStart.Z + ptsPath(i).Z - ptsPath(i - 1).Z End If For j = 0 To NdoYV 'along circle AngRot = dyV * j * math.Da Call m3RotAboutLineGetPtxyzA(mLine.pts(0), mLine.pts(1), ptStart, AngRot, ptTpt) Points(i, j).coord(0) = ptTpt.X Points(i, j).coord(1) = ptTpt.Y Points(i, j).coord(2) = ptTpt.Z Points(i, j).coord(3) = 1# Next j Next i Part B:
Public Function ClosestPtAtEndLineXyz_DistGiven(mLineXyz As LineXyz, myDist As Single) As ptXyz 'given distance to find end point of a line segment Dim ptAny As ptXyz ptAny = newPointXyz(10, 10, 10) Dim ptVFootAny As ptXyz ptVFootAny = ClosestPtToLineXyz(mLineXyz, ptAny) Dim ptAtDistGiven As ptXyz ptAtDistGiven = ptxyzonLineXyz_GivenDist(ptVFootAny, ptAny, myDist) Dim dx As Single Dim dy As Single Dim dz As Single dx = mLineXyz.pts(0).X - ptVFootAny.X dy = mLineXyz.pts(0).Y - ptVFootAny.Y dz = mLineXyz.pts(0).Z - ptVFootAny.Z ClosestPtAtEndLineXyz_DistGiven.X = ptAtDistGiven.X + dx ClosestPtAtEndLineXyz_DistGiven.Y = ptAtDistGiven.Y + dy ClosestPtAtEndLineXyz_DistGiven.Z = ptAtDistGiven.Z + dz
End Function
Public Function ReflectionPointXyz(mLineXyz As LineXyz, ptOutside As ptXyz) As ptXyz Dim ptRotBeg As ptXyz Dim ptRotEnd As ptXyz Dim ptReflect As ptXyz ptRotBeg = mLineXyz.pts(0) ptRotEnd = mLineXyz.pts(1) Call m3RotAboutLineGetPtxyzA(ptRotBeg, ptRotEnd, ptOutside, 180, ptReflect) ReflectionPointXyz = ptReflect End Function
Public Sub m3RotAboutLineGetPtxyzA(ptRotBeg As ptXyz, ptRotEnd As ptXyz, ptIn As ptXyz, CitaDeg As Single, ptOut As ptXyz) Dim A As Single, B As Single, C As Single, U As Single, V As Single, W As Single, CitaR As Single, L As Single Dim Xin As Single, Yin As Single, Zin As Single A = ptRotBeg.X' B = ptRotBeg.Y C = ptRotBeg.Z U = ptRotEnd.X - ptRotBeg.X V = ptRotEnd.Y - ptRotBeg.Y W = ptRotEnd.Z - ptRotBeg.Z Xin = ptIn.X Yin = ptIn.Y Zin = ptIn.Z CitaR = CitaDeg * PI / 180# L = Sqr(U ^ 2 + V ^ 2 + W ^ 2)
ptOut.X = (A * (L ^ 2 - U ^ 2) + U * (-B * V - C * W + U * Xin + V * Yin + W * Zin) + ((Xin - A) * (L ^ 2 - U ^ 2) + U * (B * V + C * W - V * Yin - W * Zin)) * Cos(CitaR) _ + L * (-C * V + B * W - W * Yin + V * Zin) * Sin(CitaR)) / L ^ 2 ptOut.Y = (B * (L ^ 2 - V ^ 2) + V * (-A * U - C * W + U * Xin + V * Yin + W * Zin) + ((Yin - B) * (L ^ 2 - V ^ 2) + V * (A * U + C * W - U * Xin - W * Zin)) * Cos(CitaR) _ + L * (C * U - A * W + W * Xin - U * Zin) * Sin(CitaR)) / L ^ 2 ptOut.Z = (C * (L ^ 2 - W ^ 2) + W * (-A * U - B * V + U * Xin + V * Yin + W * Zin) + ((Zin - C) * (L ^ 2 - W ^ 2) + W * (A * U + B * V - U * Xin - V * Yin)) * Cos(CitaR) _ + L * (-B * U + A * V - V * Xin + U * Yin) * Sin(CitaR)) / L ^ 2
End Sub
http://vlog.xuite.net/play/MmhYbWNzLTgzOTQ1MTIuZmx2 ContourPlot_0001 @ 隨意窩 Xuite 影音
|
上次修改此網站的日期: 2018年11月25日